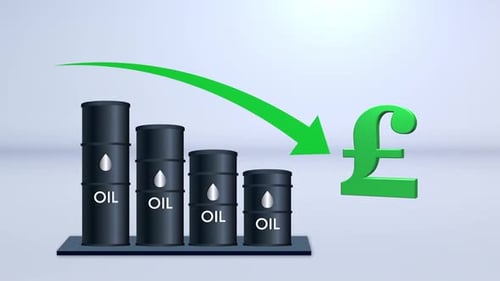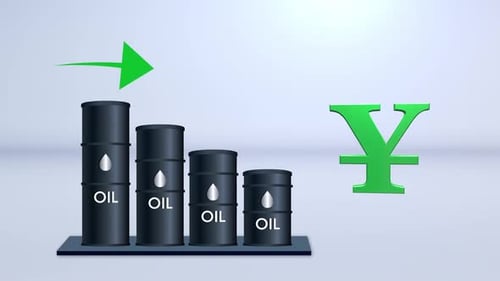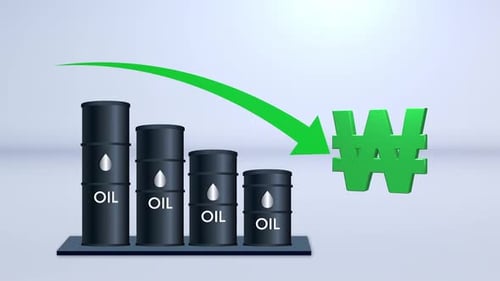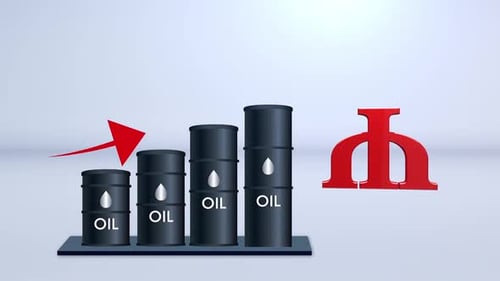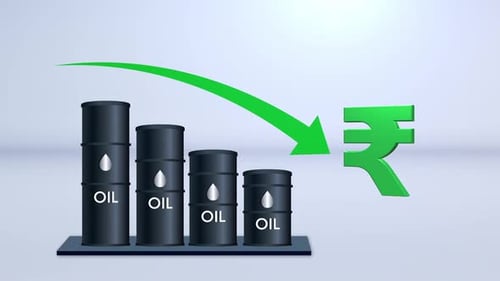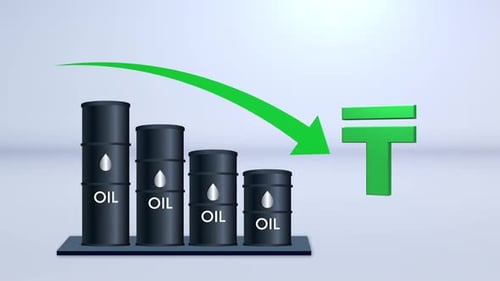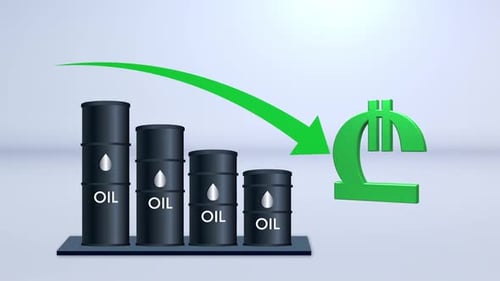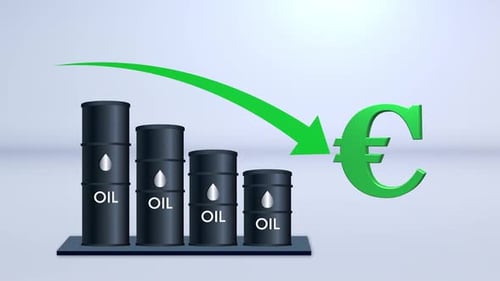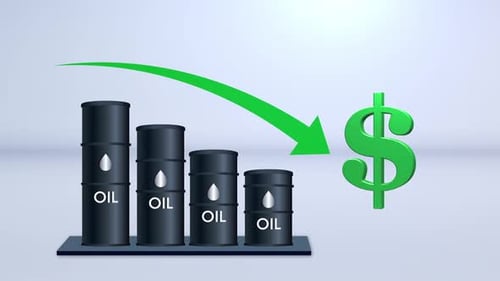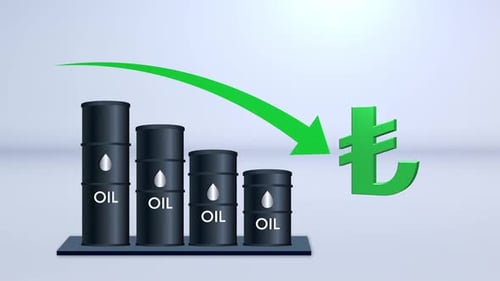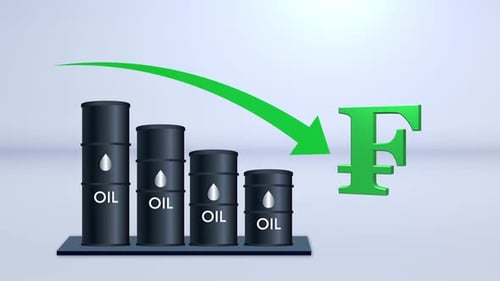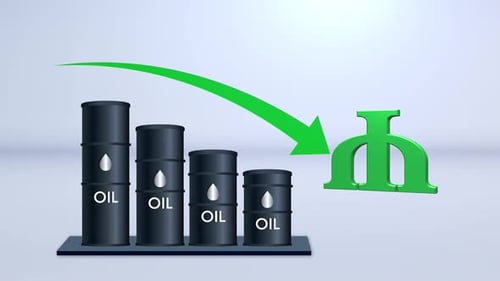
Animated Oil Price Drop Graph with Currency Decline
By PixoArtOne great value subscription from $16.50/month
- Unlimited downloads of 26+ million creative assets
- AI Tools: video, image and more
- Lifetime commercial license
- Easy cancellation
Already have an account? Sign in
Attributes
- Length
- 0:08
- Resolution
- 1920 x 1080
- File Size
- 943 KB
- Frame Rate
- 29.97 fps
- Alpha Channel
- No
- Looped
- No
- Video Encoding
- H.264
- Orientation
- Horizontal
- Commercial License
- Further Information
Description
This animated clip visualizes a decrease in value, likely related to oil prices and currency exchange rates. Three-dimensional oil barrels smoothly form a bar graph, with their heights diminishing from left to right. A dynamic green arrow sweeps downwards, visually reinforcing the trend of decline. A prominent currency symbol, the Azerbaijani Manat, is also displayed, suggesting a correlation with the falling commodity value. The clean, modern design with subtle reflections provides a professional and clear presentation of data. This asset is ideal for financial news, market analysis, economic reports, or corporate presentations illustrating commodity price drops and their impact on currency.