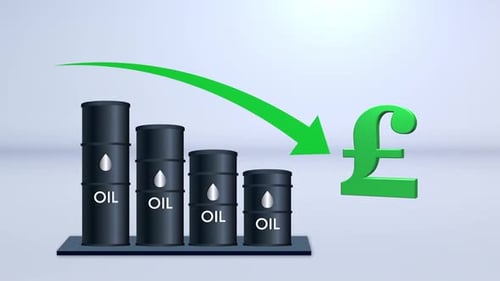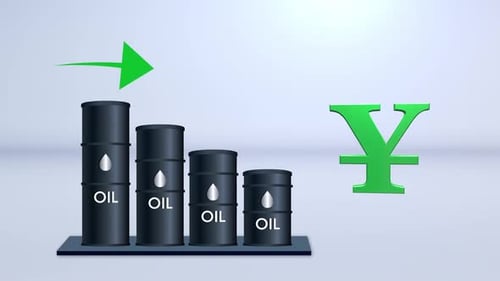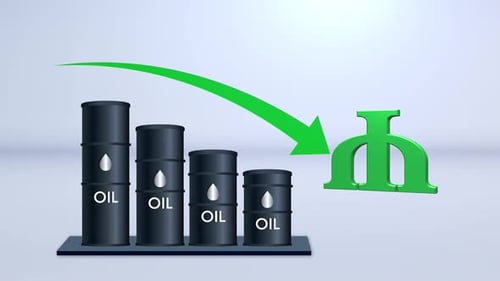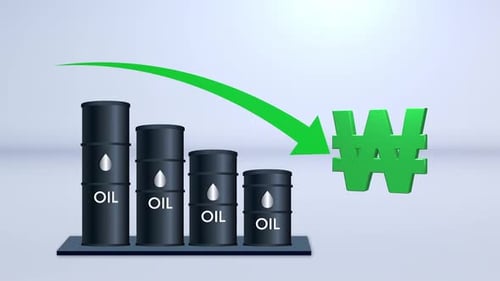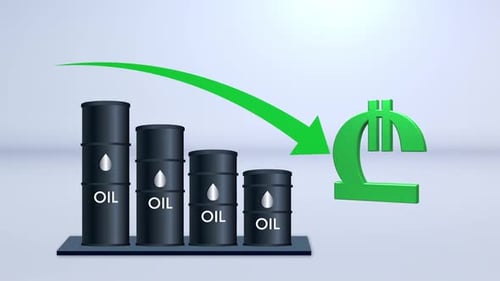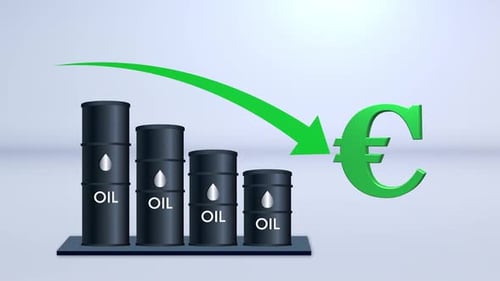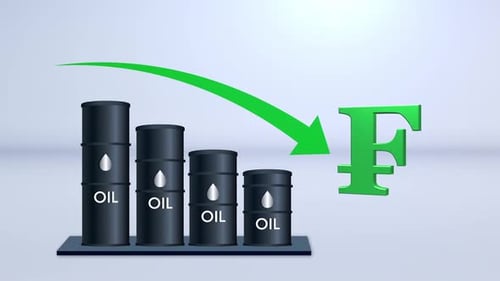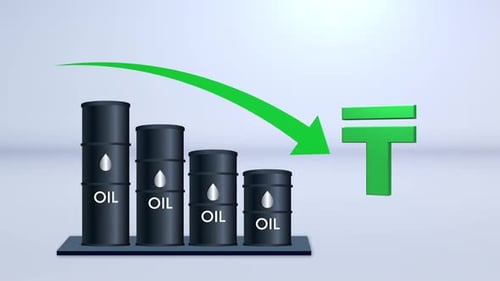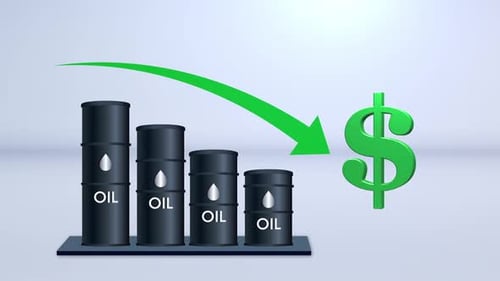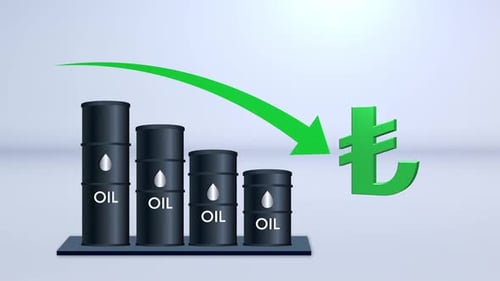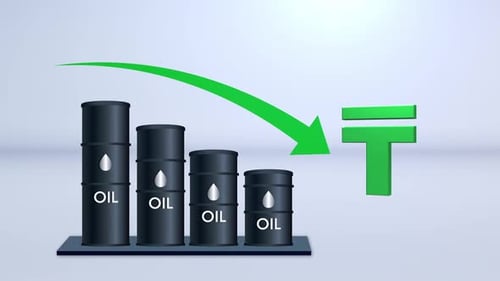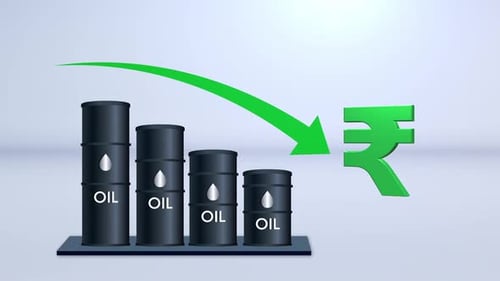
Animated Bar Chart Showing Oil Price Drop with Rupee Symbol
By PixoArtOne great value subscription from $16.50/month
- Unlimited downloads of 26+ million creative assets
- AI Tools: video, image and more
- Lifetime commercial license
- Easy cancellation
Already have an account? Sign in
Attributes
- Length
- 0:08
- Resolution
- 1920 x 1080
- File Size
- 822 KB
- Frame Rate
- 29.97 fps
- Alpha Channel
- No
- Looped
- No
- Video Encoding
- H.264
- Orientation
- Horizontal
- Commercial License
- Further Information
Description
This animated bar chart visualizes a decline in oil prices, effectively demonstrating economic trends. Black oil barrels, each labeled 'OIL' and featuring a droplet icon, dynamically decrease in height from left to right, forming a bar graph. A prominent green arrow arcs downwards from left to right, illustrating the falling trend, positioned above a static, bold green Indian Rupee symbol. This clean and modern visual asset is ideal for financial reports, business presentations, market analysis videos, or any project requiring a clear and impactful depiction of decreasing economic value or commodity prices.